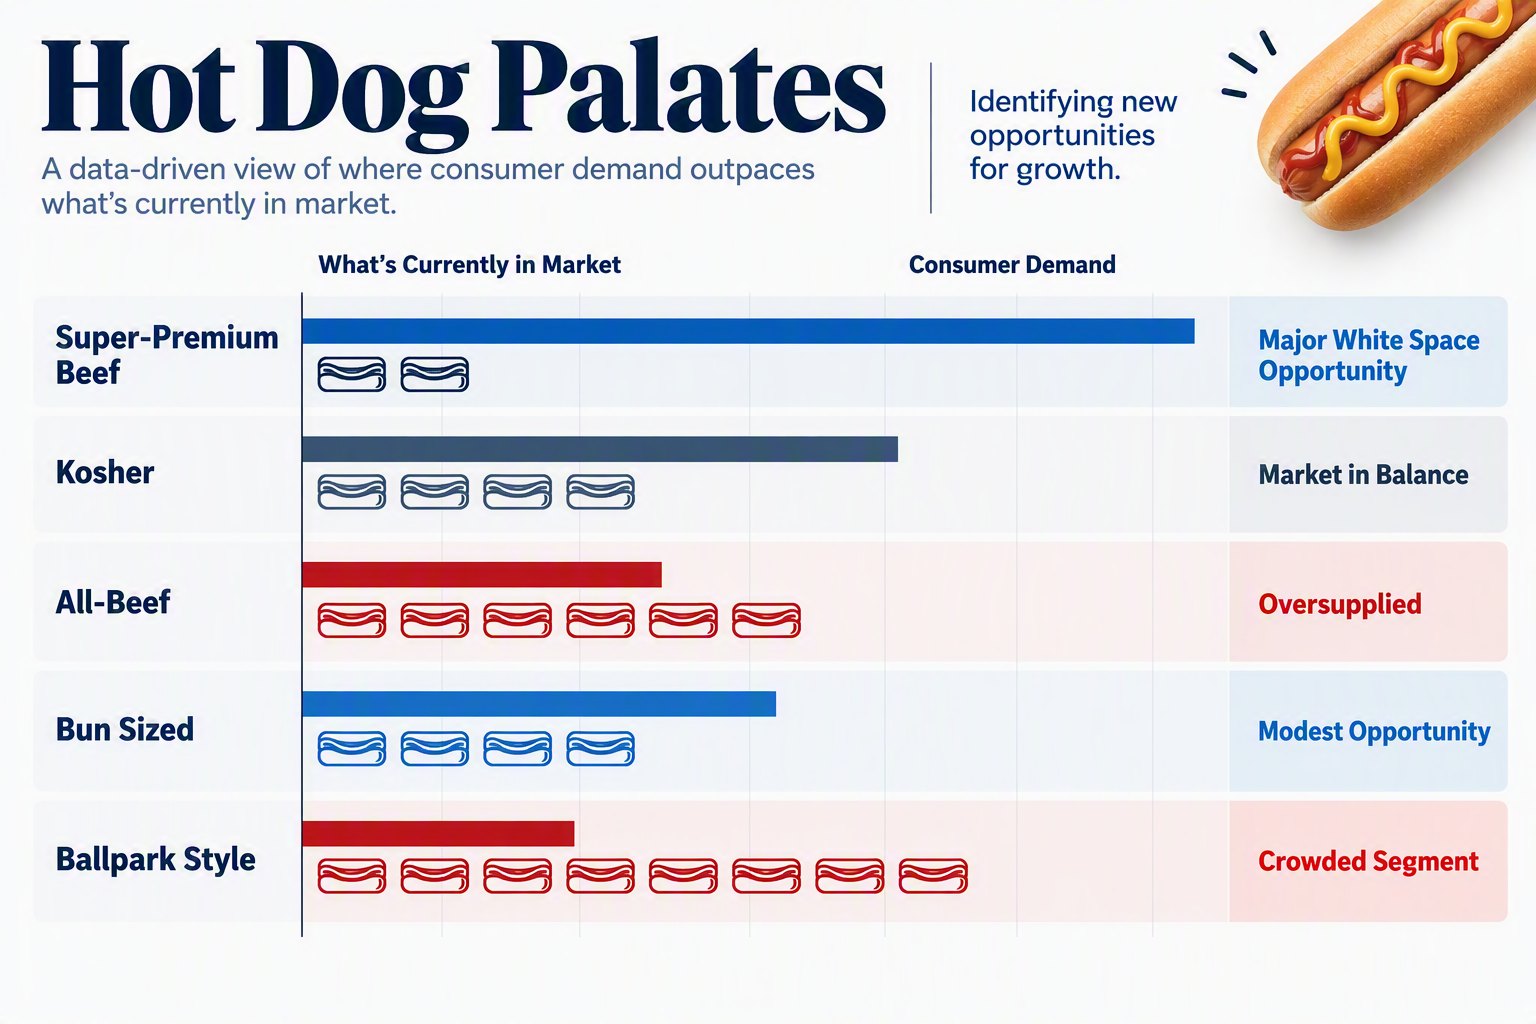
Palate Maps™ compares what consumers ideally want with what the market currently provides — revealing where demand is underserved so you can make better innovation, portfolio and retailer decisions.
Used by leading Food & Beverage innovation leaders.
You can have a deep understanding of your category — and still miss significant growth opportunities.
You can…
see what’s selling
track which trends are growing
monitor what competitors are launching
understand consumer needs
rigorously test the concepts you’ve created
But do you know where today’s shelves are falling short of what consumers actually want?
The opportunity
Palate Maps find the growth you are missing.
Most market views are inevitably influenced by the products and choices that already exist. Palate Maps starts one step earlier. It identifies the product experience a consumer would ideally want for a particular consumption occasion.
Consumers make trade-offs across the attributes that define that experience. Depending on the category, those can include:
Flavor
Texture
Sweetness
Ingredients
Benefits
Claims
Format
Preparation
Packaging
Those combinations of ideal preferences form distinct product experiences.
How Palate Maps works
Once you can see ideal demand, you can see where the market isn’t serving it.
01
Quantify ideal demand
Identify the product experiences consumers ideally want across the dimensions that matter in your category — from flavor, texture and ingredients to benefits, claims, format and packaging.
02
Map demand against supply
Map the products currently available against those Palates and compare how much consumer demand exists with how much marketplace supply serves it.
03
Turn gaps into growth decisions
Each Palate is underpinned by granular product preferences, translating whitespace into specific choices about where to innovate, what to build, which bets to back and where to focus the portfolio.
Illustrative
The bar is consumer demand; each hot dog is what’s currently in market. Where the bar runs past the hot dogs, demand outpaces supply.
Charts on this page are illustrative and do not represent a specific client engagement.
What it changes
Seeing the gap changes the decisions you can make.
One demand-supply gap. Different implications for your business.
Same spaces
Find less obvious places to play.
See opportunities rooted in underserved consumer demand rather than only the trends and spaces already visible to the market.
Core growth
Find growth the core may still contain.
See whether apparently mature categories contain product experiences that existing offers are not adequately serving.
Portfolio
Give every product a clearer reason to exist.
See where the portfolio is concentrated against similar demand and where consumer opportunities remain underserved.
Pipeline
Back the bets tied to the clearest gaps.
Use demand-supply imbalance to help distinguish between multiple credible innovation opportunities.
Retailer
Make the retailer growth story more specific.
Map demand and supply at retailer level to show where a customer’s assortment may be under-serving its shoppers.
Confidence
Increase confidence in your bets.
Gain greater confidence in innovation opportunities, particularly in emerging parts of the category.
Innovation Blind Spot Diagnostic
Where might you be missing growth?
Underserved demand rarely announces itself as “underserved demand.”
It can show up in the decisions your teams are already making — where you compete, when you leave the core, how you shape the portfolio, which innovation bets you fund and how you make the growth case to retailers.
Take the Innovation Blind Spot Diagnostic to uncover what’s getting in the way of your next breakthrough.
6 questions · About 3 minutes · Immediate result
Palate Maps in practice
See what changes when demand and supply are mapped together.
Client story 01 — Hot dog manufacturer
Growth found outside the occasion the category was built around.
SituationThe #2 hot dog brand, with brand and category growth stalled for three years. Strategy centred on summer grilling occasions with dads — a focused position that limited relevance for the rest of the year. The question was whether category growth was still possible, and what product characteristics would win it.
ApproachWe built a Hot Dog Palate Map from quantitative research, identifying six demand clusters based on the ideal product attributes consumers wanted in recent hot dog occasions. Sizing each Palate and mapping existing supply against demand exposed where the category was oversupplied and where it was not.
What it revealedSubstantial whitespace in super-premium beef, driven by stronger-than-expected demand among moms serving everyday family meals — not the dads-and-grilling occasion the category was built around. Angus proved a more powerful driver of taste and quality perceptions than Kosher claims.
Value createdLaunch of Angus Beef Franks, with increased pricing power and trade-up value across the portfolio, and significant supply chain cost reductions from flattening the seasonal spike.
+44%Brand growth in three years
#1Overtook Oscar Mayer for the first time in a 50-year history
Client story 02 — Frozen pizza manufacturer
A fragmenting category resolved into a single priority platform.
SituationA leading frozen-pizza manufacturer faced slowing growth as niche brands and carryout/delivery expanded. Consumer preferences were fragmenting across indulgence, health, crust formats and toppings, leaving the client unsure where to focus innovation and assortment.
ApproachWe built a Pizza Palate Map quantitatively, testing 300+ ideal product preferences across crust, toppings, indulgence, nutrition, brand cues and packaging. This revealed distinct demand clusters and exposed where the market was oversupplied or underserved.
Value createdPortfolio strategy guided resource allocation and SKU rationalisation to align supply with ideal demand. Innovation identified attractive whitespace and prioritised a new Deep/Dense platform. Retail activation — supply-versus-demand maps strengthened retailer dialogue and supported shelf reallocation toward high-demand Palates.